Seasonal Outlook
The GloFAS seasonal outlook provides forecasts of unusually high or low river flow up to four months ahead.
The user is advised to evaluate forecast skill for their particular application and we welcome any feedback.
The user is advised to evaluate forecast skill for their particular application and we welcome any feedback.
The seasonal forecast products are updated once per month and made available via the forecast viewer on the 10th of each month.
The seasonal outlook is produced by forcing the Lisflood river routing model with surface and sub-surface runoff from SEAS5, the latest version of ECMWF’s seasonal forecasting system, which consists of 51 ensemble members at ~35km horizontal resolution.
This produces a probabilistic forecast of river flow at 0.1o horizontal resolution (~10km, the resolution of Lisflood) out to four months. The river flow forecasts are initialised using the latest ERA-5 model reanalysis, and the reference climatology used to determine the thresholds of high and low river flow is the 18-year GloFAS-Seasonal reforecast dataset. River flow observations are not currently used in the system.
All GloFAS seasonal outlook products are based on weekly-averaged (using calendar weeks; Monday to Sunday) river flow. As the seasonal forecast products are made available on the 10th of each month, the map layers do not include the first two weeks of the forecast in order to reflect this.
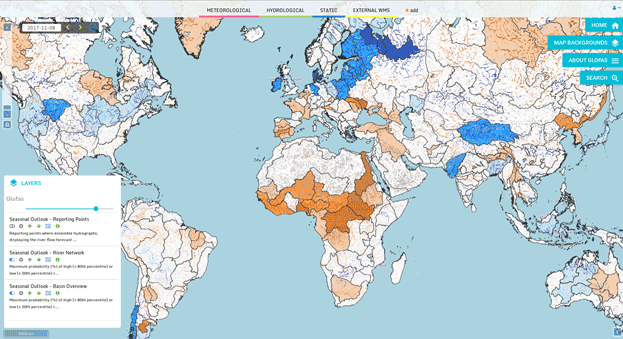
The first GloFAS-Seasonal layer (Figure 1) gives a quick overview of the upcoming situation over the next four months, for 305 major world river basins. This layer displays the maximum probability of unusually high (blue shading) or low (orange shading)
river flow (compared to the model climatology) occurring during the four months of the forecast.
The darker the colour, the higher the probability. If the maximum probability of high or low river flow does not exceed 50%, then the basin remains white. This probability is calculated by taking the average of the maximum probability at each grid point in the river basin. The thresholds for high or low river flow are determined using the 80th and 20th percentile of the model climatology, corresponding to the time of year. If, during the four month forecast horizon, the forecast exceeds both the upper and lower threshold, the map is coloured according to which of these is more probable.
The darker the colour, the higher the probability. If the maximum probability of high or low river flow does not exceed 50%, then the basin remains white. This probability is calculated by taking the average of the maximum probability at each grid point in the river basin. The thresholds for high or low river flow are determined using the 80th and 20th percentile of the model climatology, corresponding to the time of year. If, during the four month forecast horizon, the forecast exceeds both the upper and lower threshold, the map is coloured according to which of these is more probable.

Figure 1: First GloFAS seasonal outlook layer, displaying the maximum probability of high (blue) or low (orange) river flow occurring during the four month forecast horizon, for major world river basins.
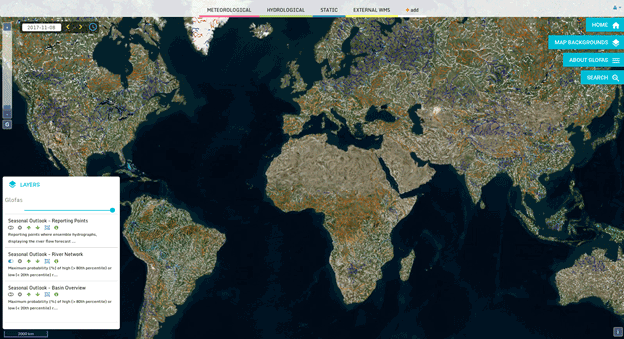
The second GloFAS-Seasonal layer (Figure 2) provides further detail at the sub-basin scale, by colouring the global river network (based on the model river network) according to the maximum probability of high (blue shading) or low (orange shading) river
flow occurring during the four month forecast horizon.
At present, only river points with an upstream area larger than 1500km2 are shown. The thresholds for high or low river flow are determined for each pixel, using the 80th and 20th percentile of the model climatology, corresponding to the time of year. Pixels shown in light grey are those where the forecast does not exceed a 50% probability of high or low flow during the next 4 months. Pixels showing a darker grey-brown are in climatologically arid areas where the probability cannot be defined in any week of the forecast. Forecasts which indicate unusual conditions in these areas are still shown with the standard forecast colours (orange, blue or light grey).
At present, only river points with an upstream area larger than 1500km2 are shown. The thresholds for high or low river flow are determined for each pixel, using the 80th and 20th percentile of the model climatology, corresponding to the time of year. Pixels shown in light grey are those where the forecast does not exceed a 50% probability of high or low flow during the next 4 months. Pixels showing a darker grey-brown are in climatologically arid areas where the probability cannot be defined in any week of the forecast. Forecasts which indicate unusual conditions in these areas are still shown with the standard forecast colours (orange, blue or light grey).

Figure 2: Second GloFAS seasonal outlook layer, displaying maximum probability of high (blue) or low (orange) river flow occurring during the four month forecast horizon, for the global river network.
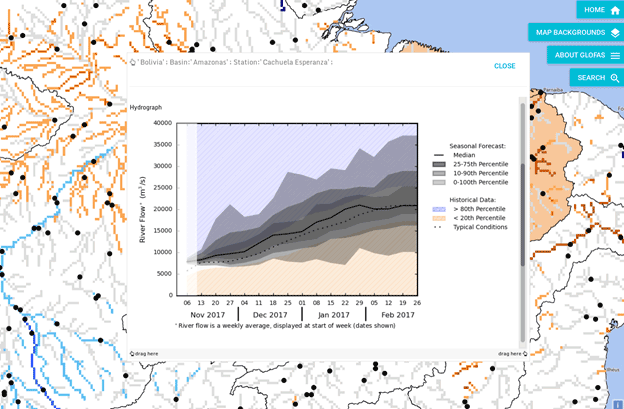
The third GloFAS-Seasonal layer provides reporting points (both dynamic and permanent) with global coverage, where additional forecast information is available. Ensemble hydrographs (Figure 3) are provided at each reporting point, displaying the probabilistic
forecast (grey shading) of weekly-averaged river flow out to 4 months, alongside key thresholds calculated from the model climatology.
The first 10 days of the forecast are faded to reflect the release date of the seasonal forecast products on the 10th of each month. Blue shading indicates the 80th percentile of the model climatology and above; orange the 20th percentile and below. Typical conditions (median of model climatology) are indicated by the dotted line.
These thresholds allow comparison of the forecast with typical conditions and extreme conditions for the given location and for the time of year.
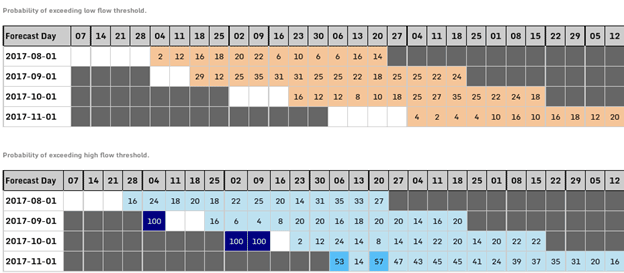
Persistence diagrams (figure 4) are also provided at each reporting point, displaying the probability of exceeding the high and low flow thresholds for each week of the forecast horizon, for the current and previous three forecasts.
This indicates the evolution and consistency of the forecasts. The colours used are the same as those shown on the maps, and forecasts in a climatologically arid area where the probabilities cannot be defined (grey-brown on the maps) are displayed in dark grey with a white *.

Figure 3: GloFAS seasonal outlook ensemble hydrograph for the following 4 months. Hydrographs are available at reporting points with global coverage, and display the forecast probabilities (grey) against thresholds based on the model climatology.

Figure 4: GloFAS seasonal outlook persistence diagram. These are available at reporting points with global coverage, and display the probability of exceeding the high and low flow thresholds for each week of the forecast, for the current (bottom row) and previous three forecasts. The dates shown indicate the start of the calendar week for which the forecast applies.
