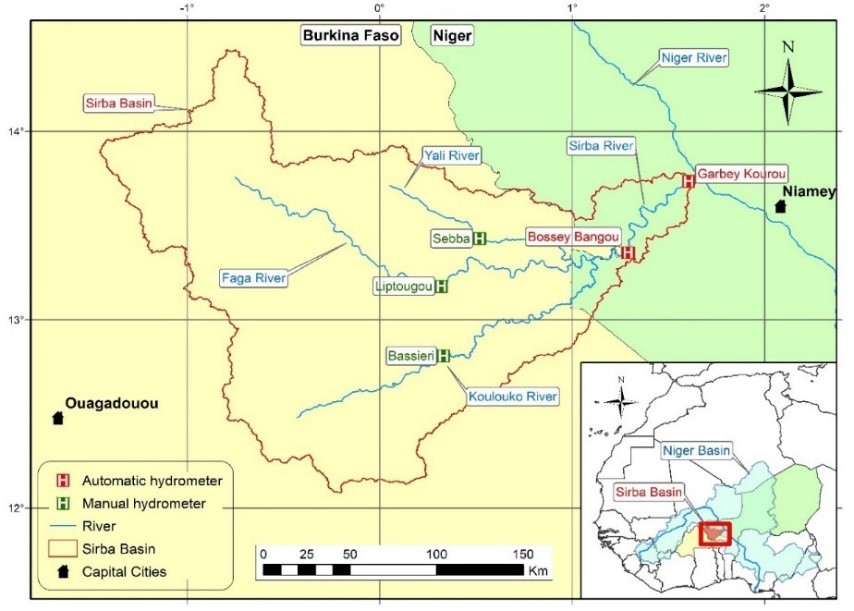
ANADIA 2.0 Project (Climate Change Adaptation, Disaster Reduction and Agricultural Development for Food Security - Phase 2), funded by the Italian Agency for Development Cooperation (AICS) in Niger, developed a flood Early Warning System (EWS) on the Sirba River, the major tributary of the Middle Niger River Basin. The EWS is based on real-time measurements of the hydrometric stations and the river discharge forecasts of the Global Flood Awareness System (GloFAS). This case study analyses the performance of the raw and bias corrected GloFAS v1.0 and v2.0 forecasts and evaluates the added value of the improved forecasts to support the alert system, ultimately helping the exposed communities.
Context: In the last decades the Sahelian area has known a radical evolution of surface hydrology that was particularly intense in the Sirba River. Hydrologic changes and high rates of population growth have produced a dramatic increase of flood events and flood-related damages, respectively.
 Figure 1.
EWS: The Sirba Flood EWS (in French SLAPIS - Système Locale d’Alerte Précoce pour les Inondations de la Sirba), is managed by Directorate for Hydrology of Niger and has been developed by a multidisciplinary collaboration between Polytechnic of Turin, institute of Bio-Economy of the Italian National Research Council and Directorate for Meteorology of Niger.
SLAPIS has been conceived as a Community and Impact Based Early Warning System that was co-designed with local stakeholders keeping in mind the four key elements of people-centred early warning:
a) risk knowledge,
b) monitoring and warning service,
c) dissemination and communication,
d) response capability.
Approach: The system is based on the integration of local observations with hydrological forecasts. The hazard thresholds connect the hydrology with the mapping of flood-prone areas and with the local plans for flood-risk reduction. The information platform is integrated with the national alert decision making scheme and, starting from June 2019, is operational on the web: www.slapis-niger.org.
Method: This study analyses the performance of GloFAS v1.0 and v2.0 at Garbey Kourou. The model verification was performed using continuous (RSR and NSE) and categorical (BIAS, POD, FAR, PC, TS and HSS) indices computed with the available GloFAS reforecasts in 2008-2018 and the climatology-based flood thresholds. A linear-regression-based bias correction was applied throughout the homogeneous periods of the wet season. The datasets were divided into two 5-year periods for training and validation. The verification was done on 5-day forecasts which was a suitable alert lead time for the project purposes.
Table 1.
Continuous and categorical indices of original and optimized (5-day) forecasts of GloFAS 1.0 and 2.0 in the verification years 2013–2017.
Best performance is shown in bold.
| Index | GloFAS 1.0 | GloFAS 2.0 | Optimized GloFAS 1.0 | Optimized GloFAS 2.0 |
|---|---|---|---|---|
| RSR (-) | 1.07 | 1.10 | 1.01 | 0.72 |
| NSE (-) | -0.13 | -0.21 | -0.03 | 0.48 |
| BIAS (-) | 0.34 | 0.42 | 1.75 | 0.28 |
| POD (-) | 0.06 | 0.17 | 0.33 | 0.10 |
| FAR (-) | 0.82 | 0.60 | 0.81 | 0.65 |
| PC (%) | 93.9 | 94.6 | 89.5 | 94.6 |
| TS (-) | 0.05 | 0.13 | 0.13 | 0.08 |
| HSS (-) | 0.07 | 0.21 | 0.18 | 0.13 |
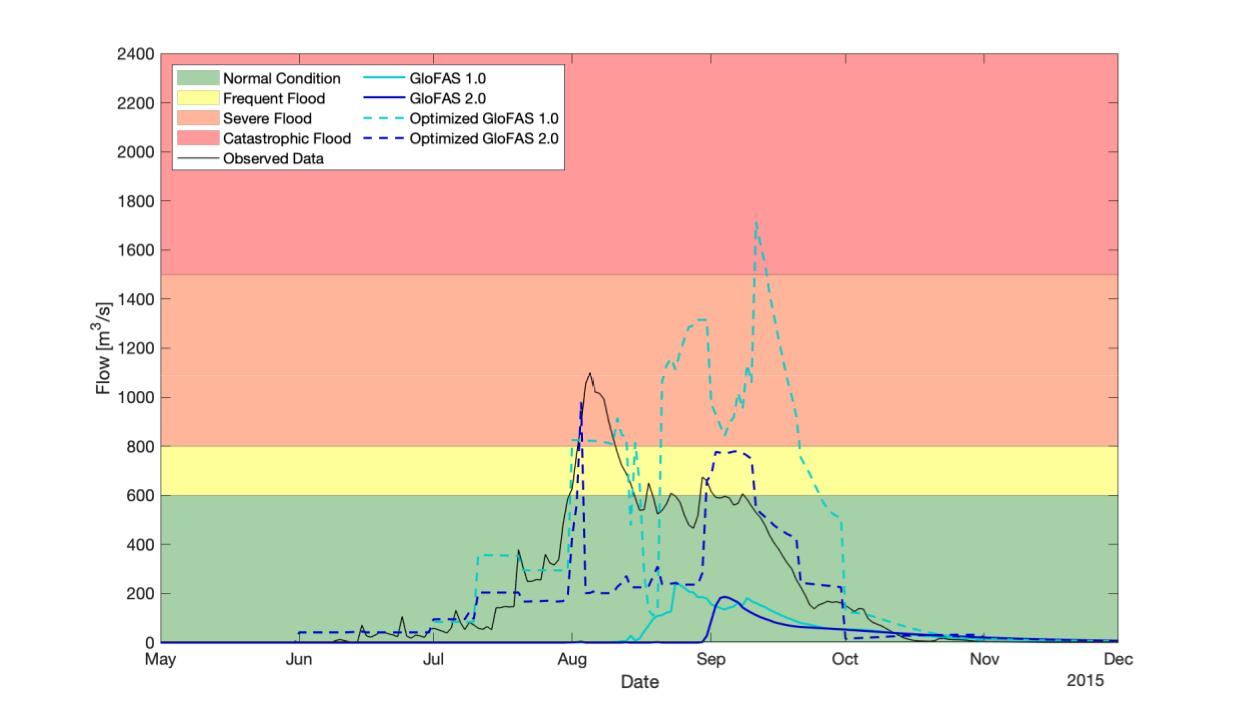
Results: The results show that the bias correction improved the performance of both GloFAS v1.0 and v2.0. However, the GloFAS v2.0 forecasts, which include calibration of the routing processes, provided a better basis and resulted in a largely improved quality. This performance was considered to be high enough to support the EWS in the area (Table 1 and Figure 2).
 Figure 2.